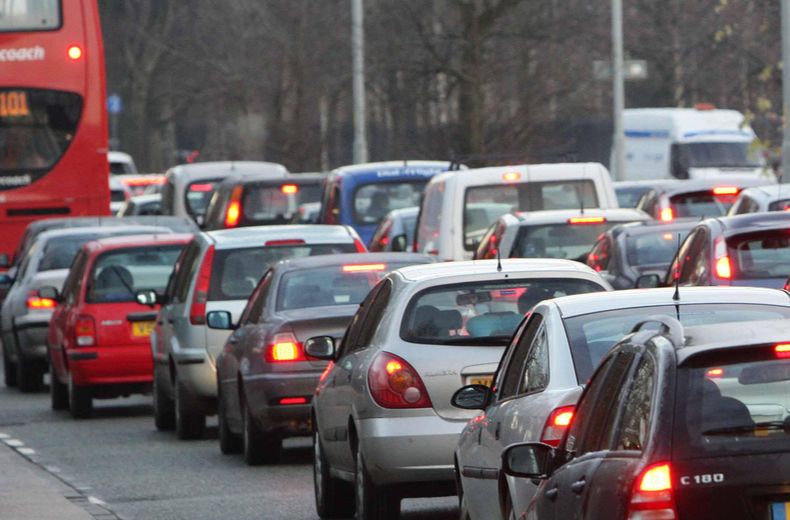
Transport data firm Inrix calculated that congestion on the roads costs an annual average of £1,317 per driver, with London hit hardest.
Motorists in the capital lost up to £1,680 last year due to being stuck in traffic jams, ahead of Edinburgh (£1,219) and Manchester (£1,157).
RAC spokesperson Rod Dennis says the figures show the enormous cost of congestion, from the impact on business to higher levels of air pollution.
- Parking guide: where you can and can’t park
- Seasonal traffic news
- Sat navs set to have algorithms updated to move traffic away from shortcuts and back to main roads
- The final straw: traffic 'scarecrows' try to slow down drivers on rural roads
- Drivers ‘see red’ when they’re kept waiting on green for more than three seconds

Cheaper than AA or we'll beat by 20%^
• Roadside cover from £5.49 a month*
• We get to most breakdowns in 60 mins or less
• Our patrols fix 4/5 breakdowns on the spot

Congestion and slow-moving traffic make it harder to transport goods and people around cities, reducing productivity while increasing air pollution and accident rates.
Analysis shows London and Edinburgh are the UK’s slowest moving cities, with average speeds of just 7mph during peak hours in their central business districts.
When it comes to individual roads, the A406 between Chiswick Roundabout and Hanger Lane in West London is the slowest route in the country.
Here, each driver spent an average of 61 hours sitting in traffic on the road last year, well ahead of the country’s second most congested route, the A23 from Kennington to Thornton Road (56 hours).
Outside of London, the most congested routes were the Leeds Road/Saltaire Road in Leeds and the A34 Stratford Road in Birmingham, which saw drivers spend 44 hours stuck in jams.
- How to guide — bay parking for your driving test
- Economy lost £8 billion to traffic jams in 2018 - see the nationwide congestion rankings
Mr Dennis said: “While congestion has for some been seen as a marker of a successful city, there can be no doubting the enormous cost of it.
“Last year UK drivers told us that they are actually becoming more, not less reliant on using their cars – with struggling public transport cited as one of the reasons.
“This is a serious concern when you consider the limited physical space in our cities and the growing pressures to move large numbers of people around to get to their places of work and leisure.”
He added: “Those cities that are best placed to grow will be those that are developing public transport systems that suit the needs of their citizens, and successfully decide the role the private car should play alongside these.”
Curious as to how your area stacks up with the rest of the country? Inrix have published the nationwide rankings:
| 2018 Impact Rank | Urban Area | Hours Lost in Congestion | Last Mile Speed (MPH) |
|---|---|---|---|
| 6 | London | 227 | 7 |
| 51 | Birmingham | 134 | 12 |
| 54 | Glasgow | 99 | 11 |
| 85 | Manchester | 156 | 10 |
| 86 | Bristol | 149 | 8 |
| 87 | Edinburgh | 165 | 8 |
| 90 | Sheffield | 149 | 10 |
| 98 | Leicester | 155 | 11 |
| 101 | Leeds | 143 | 13 |
| 104 | Liverpool | 119 | 10 |
| 121 | Belfast | 190 | 8 |
| 131 | Cardiff | 143 | 9 |
| 140 | Nottingham | 149 | 10 |
| 142 | Hull | 151 | 12 |
| 147 | Newcastle | 90 | 19 |
Impact Rank: Impact rank is a calculated commute based upon a city’s population and the delay attributable to congestion. The Impact Ranking includes a weighting based on city population.
Urban Area: The geographic scope of a city as defined by its road network density.
Hours Lost in Congestion: The total number of hours lost in congestion during peak commute periods compared to free-flow conditions.
Last Mile Speed: The speed at which a driver can expect to travel one mile into the central business district during peak hours.
The INRIX 2018 Global Traffic Scorecard rankings
| 2018 Impact Rank | Urban Area | Hours Lost in Congestion | Last Mile Speed (MPH) |
|---|---|---|---|
| 1 | Moscow | 210 | 11 |
| 2 | Istanbul | 157 | 10 |
| 3 | Bogota | 272 | 7 |
| 4 | Mexico City | 218 | 9 |
| 5 | São Paulo | 154 | 10 |
| 6 | London | 227 | 7 |
| 7 | Rio de Janeiro | 199 | 13 |
| 8 | Boston, MA | 164 | 11 |
| 9 | Saint Petersburg | 200 | 11 |
| 10 | Rome | 254 | 8 |
| 11 | Ankara | 128 | 12 |
| 12 | Izmir | 154 | 10 |
| 13 | Sydney | 138 | 10 |
| 14 | Singapore | 105 | 15 |
| 15 | Berlin | 154 | 11 |
Copyright Press Association 2019. Motoring News articles do not reflect the RAC's views unless clearly stated.
Did you know, you can get fined for moving out of the way of an ambulance?
Want more useful content like this sent straight to your inbox?


